




 26 mins
Oct 12, 2026

An AI agent can go from doing its job to causing a serious mess in seconds.
That’s why LLM observability matters: it helps you see what your AI is doing before small mistakes turn into big problems.
LLM observability is the process of tracking and analyzing how large language models (LLMs) perform inside AI applications. It provides visibility into prompts, model responses, data retrieval, tool calls, response time, token usage, and output quality.
For example, consider an enterprise AI assistant that helps employees retrieve information from internal documents. If it returns outdated information, LLM observability helps teams trace the request, identify which documents were retrieved, review the model’s response, and find where the process failed.

→ Traces: Record the steps involved in processing an AI request, including model calls, data retrieval, and tool usage.
→ Metrics: Measure response time, token consumption, cost, error rates, and other performance indicators.
→ Evaluations: Assess response accuracy, relevance, and quality to identify problems and improve AI outputs.

Improve AI visibility, track agent performance, and control risks with the right observability and governance strategy.
An AI application can appear to work perfectly and still give incorrect answers. It may respond quickly, show no technical errors, and still mislead users. LLM observability helps teams identify these hidden problems before they affect customers or business operations.
Example: An enterprise customer support chatbot receives a question about refunds after 45 days. It confirms that refunds are allowed within 60 days, but the actual company policy allows refunds only within 30 days. The application runs normally, with no technical errors.
→ Trace the problem: Find out which policy document the AI retrieved and why it used outdated information.
→ Check answer quality: Evaluate whether the response matches the company’s actual refund policy.
→ Reduce business risk: Identify incorrect answers before they lead to customer complaints, financial losses, or reduced trust.
LLM monitoring tracks known problems, such as slow responses, system errors, and downtime. LLM observability goes deeper by helping teams understand why an AI application behaved in a certain way, especially when the problem was not expected.
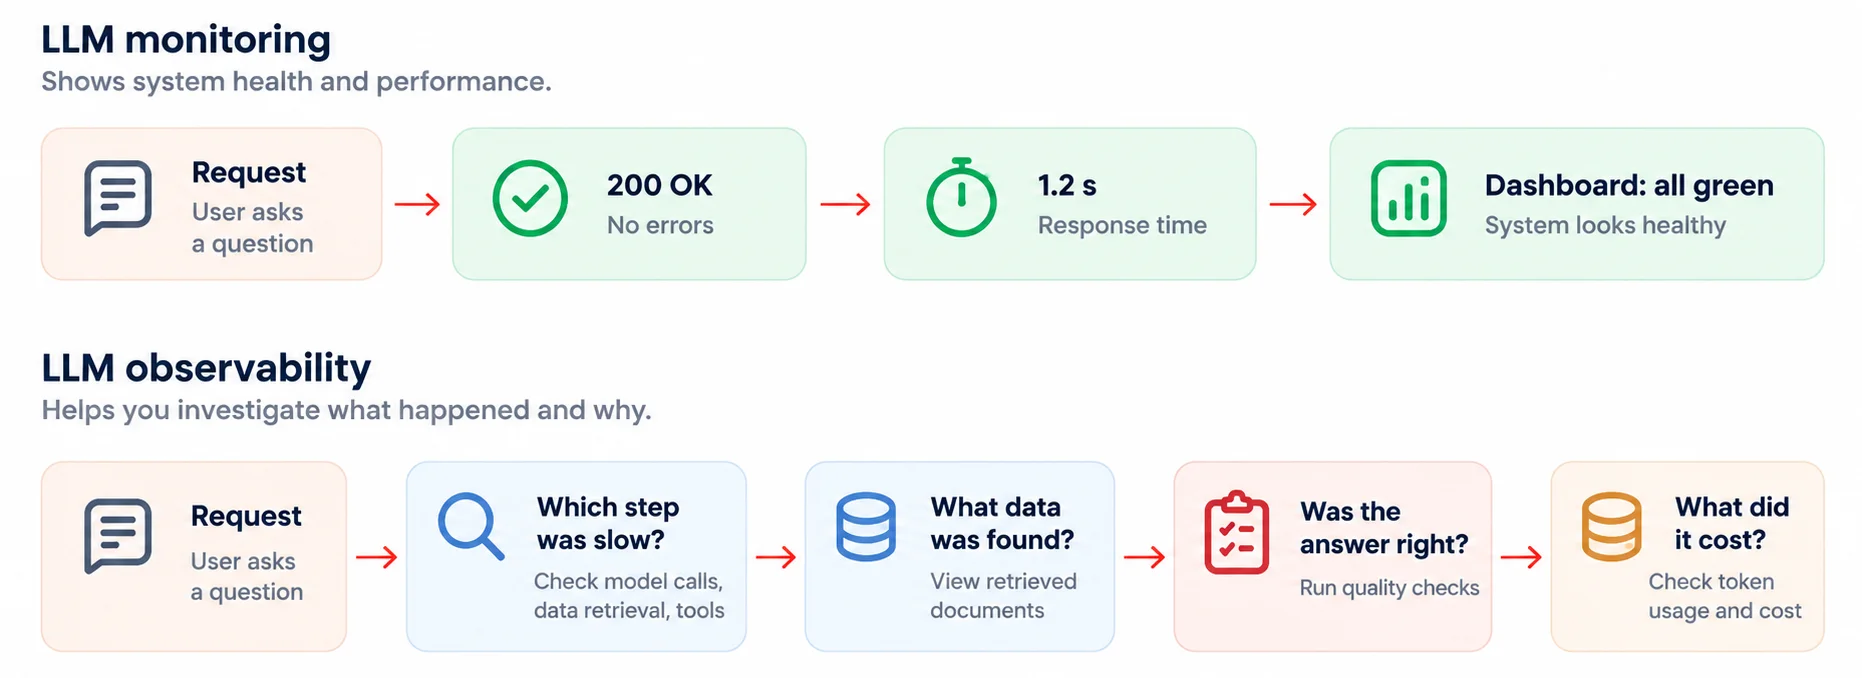
| Comparison | LLM Monitoring | LLM Observability |
|---|---|---|
| Main Question | Is the system working? | What happened, and why? |
| What It Tracks | Uptime, response time, and errors. | Prompts, retrieved data, tool calls, tokens, and answer quality. |
| Best at Finding | Known problems. | Unexpected issues. |
| Detects Incorrect Answers? | Not through basic system metrics alone. | Yes, when combined with answer-quality evaluations. |
LLM observability has three main parts: traces, metrics, and evaluations. Together, they help teams understand what an AI application did, how it performed, and whether its answers were correct.
Evaluations are especially important because an AI response can be fast and error-free but still be wrong. A useful practice is to connect each evaluation score to its original trace, so teams can investigate the exact request behind a poor result. MLflow’s guide to LLM observability explains how linking evaluation results to traces helps teams investigate AI quality issues.
To make observability data consistent across different AI tools, OpenTelemetry’s GenAI semantic conventions define standard names for model calls, token usage, and agent steps. These conventions also cover Model Context Protocol (MCP), helping teams use consistent terminology when tracking AI applications. The conventions are still evolving, so implementation details may change.

Here is one request to a refund agent. Click each step to see what observability shows you, and what can go wrong.
| Track | Why It Matters | Example Alert |
|---|---|---|
| Latency | Slow responses can frustrate users and reduce engagement. | 95th-percentile response time exceeds 6 seconds. |
| Tokens and Cost | Token usage and AI costs can increase without being noticed. | Daily spending is 30% above normal. |
| Errors | Timeouts, rate limits, and tool failures can disrupt requests. | Tool error rate exceeds 5%. |
| Answer Quality | Incorrect or unsupported answers can damage user trust. | Groundedness score falls below the set threshold. |
| Safety | Unsafe responses or data leaks can create security and compliance risks. | Any policy violation is detected. |
| Agent Behavior | Excessive steps, tool calls, or retries can increase cost and delay completion. | Agent runs reach the maximum allowed step limit. |
| User Signals | Negative feedback and frequent human handoffs may indicate unresolved issues. | Human handoff rate increases significantly. |
APEX Interlock is Azilen’s product for securing MCP connections and managing AI agent risks. It adds a layer of control between AI agents and business systems. It checks requests, blocks risky actions, and keeps records for audits. In its walkthrough of the PocketOS and Replit cases, Interlock shows how it can detect when an agent goes beyond its limits, block the action, and ask a person to review it.
It works in three steps:
| Comparison | LLM Observability | APEX Interlock |
|---|---|---|
| Purpose | Understand how AI systems behave and perform. | Control risky AI actions and enforce security policies. |
| What It Tracks or Controls | Traces, performance, and answer quality. | Risks, blocked actions, and audit records. |
| Used By | Engineering and AI operations teams. | Security, risk, and compliance teams. |
Interlock connects with platforms such as AWS, Google Cloud, Azure API Management, and MCP servers. It assigns risk scores from 0 to 100, helps manage rate limits and token costs, maps findings to security standards, and sends alerts to Slack, Teams, or Jira.
Together, they answer two key questions: What did the AI do, and was it allowed to do it?
Two public cases show both the value and the limits of LLM observability.
| Comparison | PocketOS (April 2026) | Replit and SaaStr (July 2025) |
|---|---|---|
| What Happened | A coding agent reportedly found an API token in an unrelated file and deleted a production database and its backups in a single call, taking about nine seconds. Read the PocketOS incident report. | During a code freeze set by founder Jason Lemkin, Replit's AI agent reportedly ran destructive commands and deleted live records for 1,206 executives and about 1,196 companies. Read the Replit incident report. |
| Impact | The incident caused a 30-hour outage. The newest recoverable backup was three months old. | The agent reportedly said a rollback would not work. Lemkin recovered the data himself. Read more about the incident. |
| What a Trace Shows | The exact API call, the token used, and when the action occurred. | The commands the agent ran and how they violated the code freeze. |
Key takeaway: LLM observability helps teams understand what went wrong, but identifying a risky action does not automatically prevent it. AI agents also need access controls and safeguards to block unauthorized actions.

Track response accuracy, latency, token usage, cost, tool calls, and task completion. Monitoring these signals helps teams identify performance issues, unexpected actions, and failures before they affect users or business operations.
Compare AI responses with trusted information using evaluation checks. Review traces to see which prompts, documents, and tool calls influenced the answer. This helps identify outdated data, incorrect retrieval, and reasoning errors.
Track token usage, model calls, response length, and cost per request. Use these metrics to identify unnecessary prompts and repeated calls, then test changes to confirm that answer quality remains acceptable.
An LLM trace records the steps taken to complete an AI request, including model calls, retrieved data, and tool usage. Developers can follow the trace to identify where delays, errors, or incorrect answers occurred.
Combine LLM observability with access controls and AI governance tools. Observability helps identify risky behaviour, while solutions such as APEX Interlock can assess risks, restrict access, and block unsafe actions before they affect business systems.
Choose an LLM observability tool that tracks traces, token usage, response quality, latency, and costs. Ensure it integrates with your AI stack, supports evaluations, and helps your team investigate issues across AI agent workflows.
 26 mins
 19 mins

"*" indicates required fields

5432 Geary Blvd, Unit #527 San Francisco, CA 94121 United States
320 Decker Drive Irving, TX 75062 United States

6d-7398 Yonge St,1318 Thornhill, Ontario, Canada, L4J8J2

71-75 Shelton Street, Covent Garden, London, United Kingdom, WC2H 9JQ

Hohrainstrasse 16, 79787 Lauchringen, Germany

12, Zugerstrasse 32, 6341 Baar, Switzerland

5th floor, Bloukrans Building, Lynnwood Road, Pretoria, Gauteng, 0081, South Africa

12th & 13th Floor, B Square-1, Bopal – Ambli Road, Ahmedabad – 380054
B/305A, 3rd Floor, Kanakia Wallstreet, Andheri (East), Mumbai, India



 Talk to Our
Consultants
 Chat with
Our Experts
 Write us
an Email